Note
Go to the end to download the full example code.
AUTC
Historgram and Metrics for random scores with different delta.
 9 import torch
10 import numpy as np
11 import matplotlib.pyplot as plt
12
13 from pytorch_ood.utils.metrics import binary_clf_curve
14 from pytorch_ood.utils import OODMetrics
Parameters
19 # delta between in and ood data
20 near_delta = 2
21 far_delta = 10
22
23 # split
24 in_samples_num = 9
25 out_samples_num = 1
26
27 # random torch tensors
28 offset = 10**3
29 in_scores = torch.rand(in_samples_num * offset)
30 out_scores = torch.rand(out_samples_num * offset)
Define function
36 def metrics_and_plots(in_scores, out_scores, delta, name):
37     metrics = OODMetrics()
38     # concat all scores
39     scores = torch.cat([in_scores, out_scores + delta])
40     # create labels
41     labels = torch.cat([torch.zeros_like(in_scores), torch.ones_like(out_scores)])
42     metrics.update(scores, -labels)
43     metric_dict = metrics.compute()
44     print(name, metric_dict)
45
46     # Create a single figure with two subplots
47     fig, axes = plt.subplots(1, 2, figsize=(12, 5))
48
49     # Plot histogram
50     axes[0].hist(
51         in_scores.cpu().numpy(),
52         bins=100,
53         alpha=0.5,
54         label="In-Distribution",
55         color="tab:blue",
56     )
57     axes[0].hist(
58         (out_scores + delta).cpu().numpy(),
59         bins=100,
60         alpha=0.5,
61         label="Out-of-Distribution",
62         color="tab:orange",
63     )
64     axes[0].set_title(f"{name} Histogram", weight="bold")
65     axes[0].set_xlabel("Scores")
66     axes[0].set_ylabel("Frequency")
67     axes[0].legend(loc="upper right")
68
69     # Plot FPR and FNR curve
70     fpr, tpr, thresholds = binary_clf_curve(labels, scores)
71     axes[1].plot(thresholds, fpr, label="FPR", color="tab:blue")
72     axes[1].plot(thresholds, 1 - tpr, label="FNR", color="tab:orange")
73     axes[1].set_title(f"{name} FPR and FNR", weight="bold")
74     axes[1].set_xlabel("Thresholds")
75     axes[1].set_ylabel("Rate")
76     axes[1].legend(loc="best")
77
78     # Adjust layout and save
79     plt.tight_layout()
80     plt.savefig(f"{name}_metrics_plots.png")
81     plt.show()
Plot and calculate metrics
86 metrics_and_plots(in_scores, out_scores, near_delta, "Near")
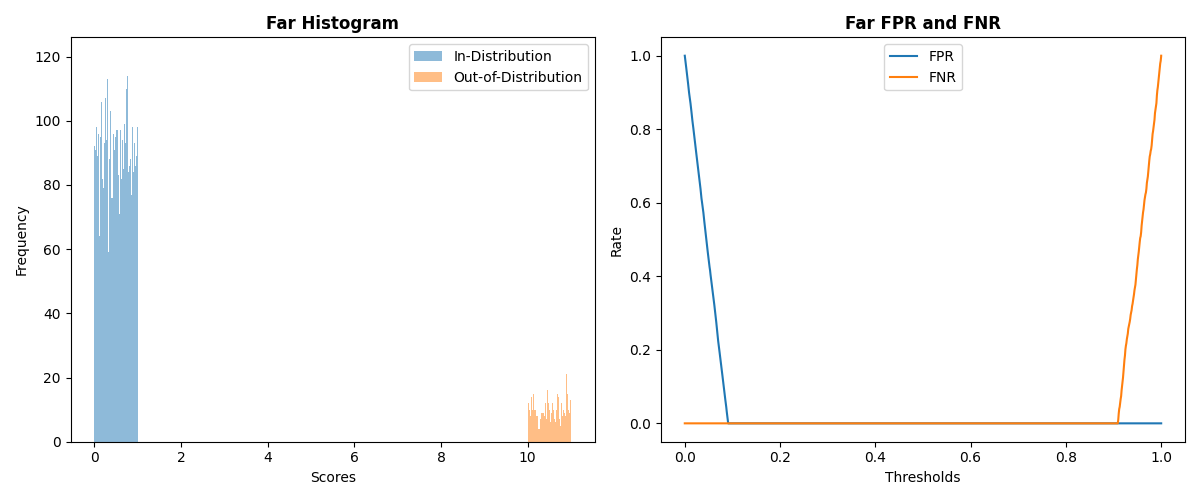
87 metrics_and_plots(in_scores, out_scores, far_delta, "Far")
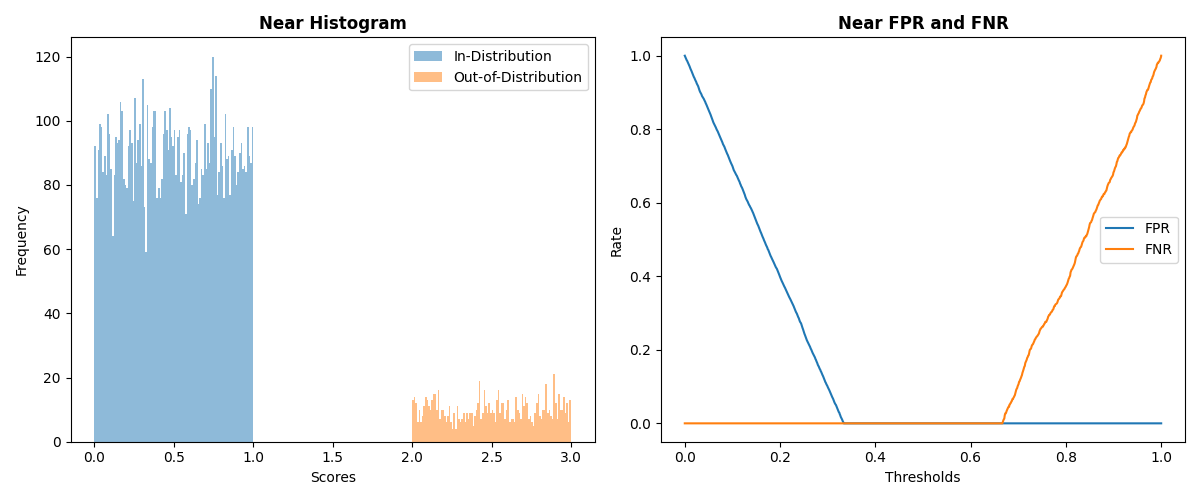
Near {'AUROC': 1.0, 'AUTC': 0.16550463438034058, 'AUPR-IN': 0.9999999403953552, 'AUPR-OUT': 1.0, 'FPR95TPR': 0.0}
Far {'AUROC': 1.0, 'AUTC': 0.04513021185994148, 'AUPR-IN': 0.9999999403953552, 'AUPR-OUT': 1.0, 'FPR95TPR': 0.0}